Getting Started with DSM v2
The onboarding flow runs once — the first time you connect BPP to your BigQuery dataset. DSM v2 walks you through a 5-step wizard: Classify Tables, User Identifiers, User Model, Event Mapping, and Review & Activate.
Your progress is saved automatically
The wizard saves your work as you go. If you reload the page, close the browser, or come back the next day, BPP resumes exactly where you left off — your table classifications, identifier mappings, and field edits are all preserved. Progress is kept per customer and is cleared once you Activate the platform.
Connection & Dataset
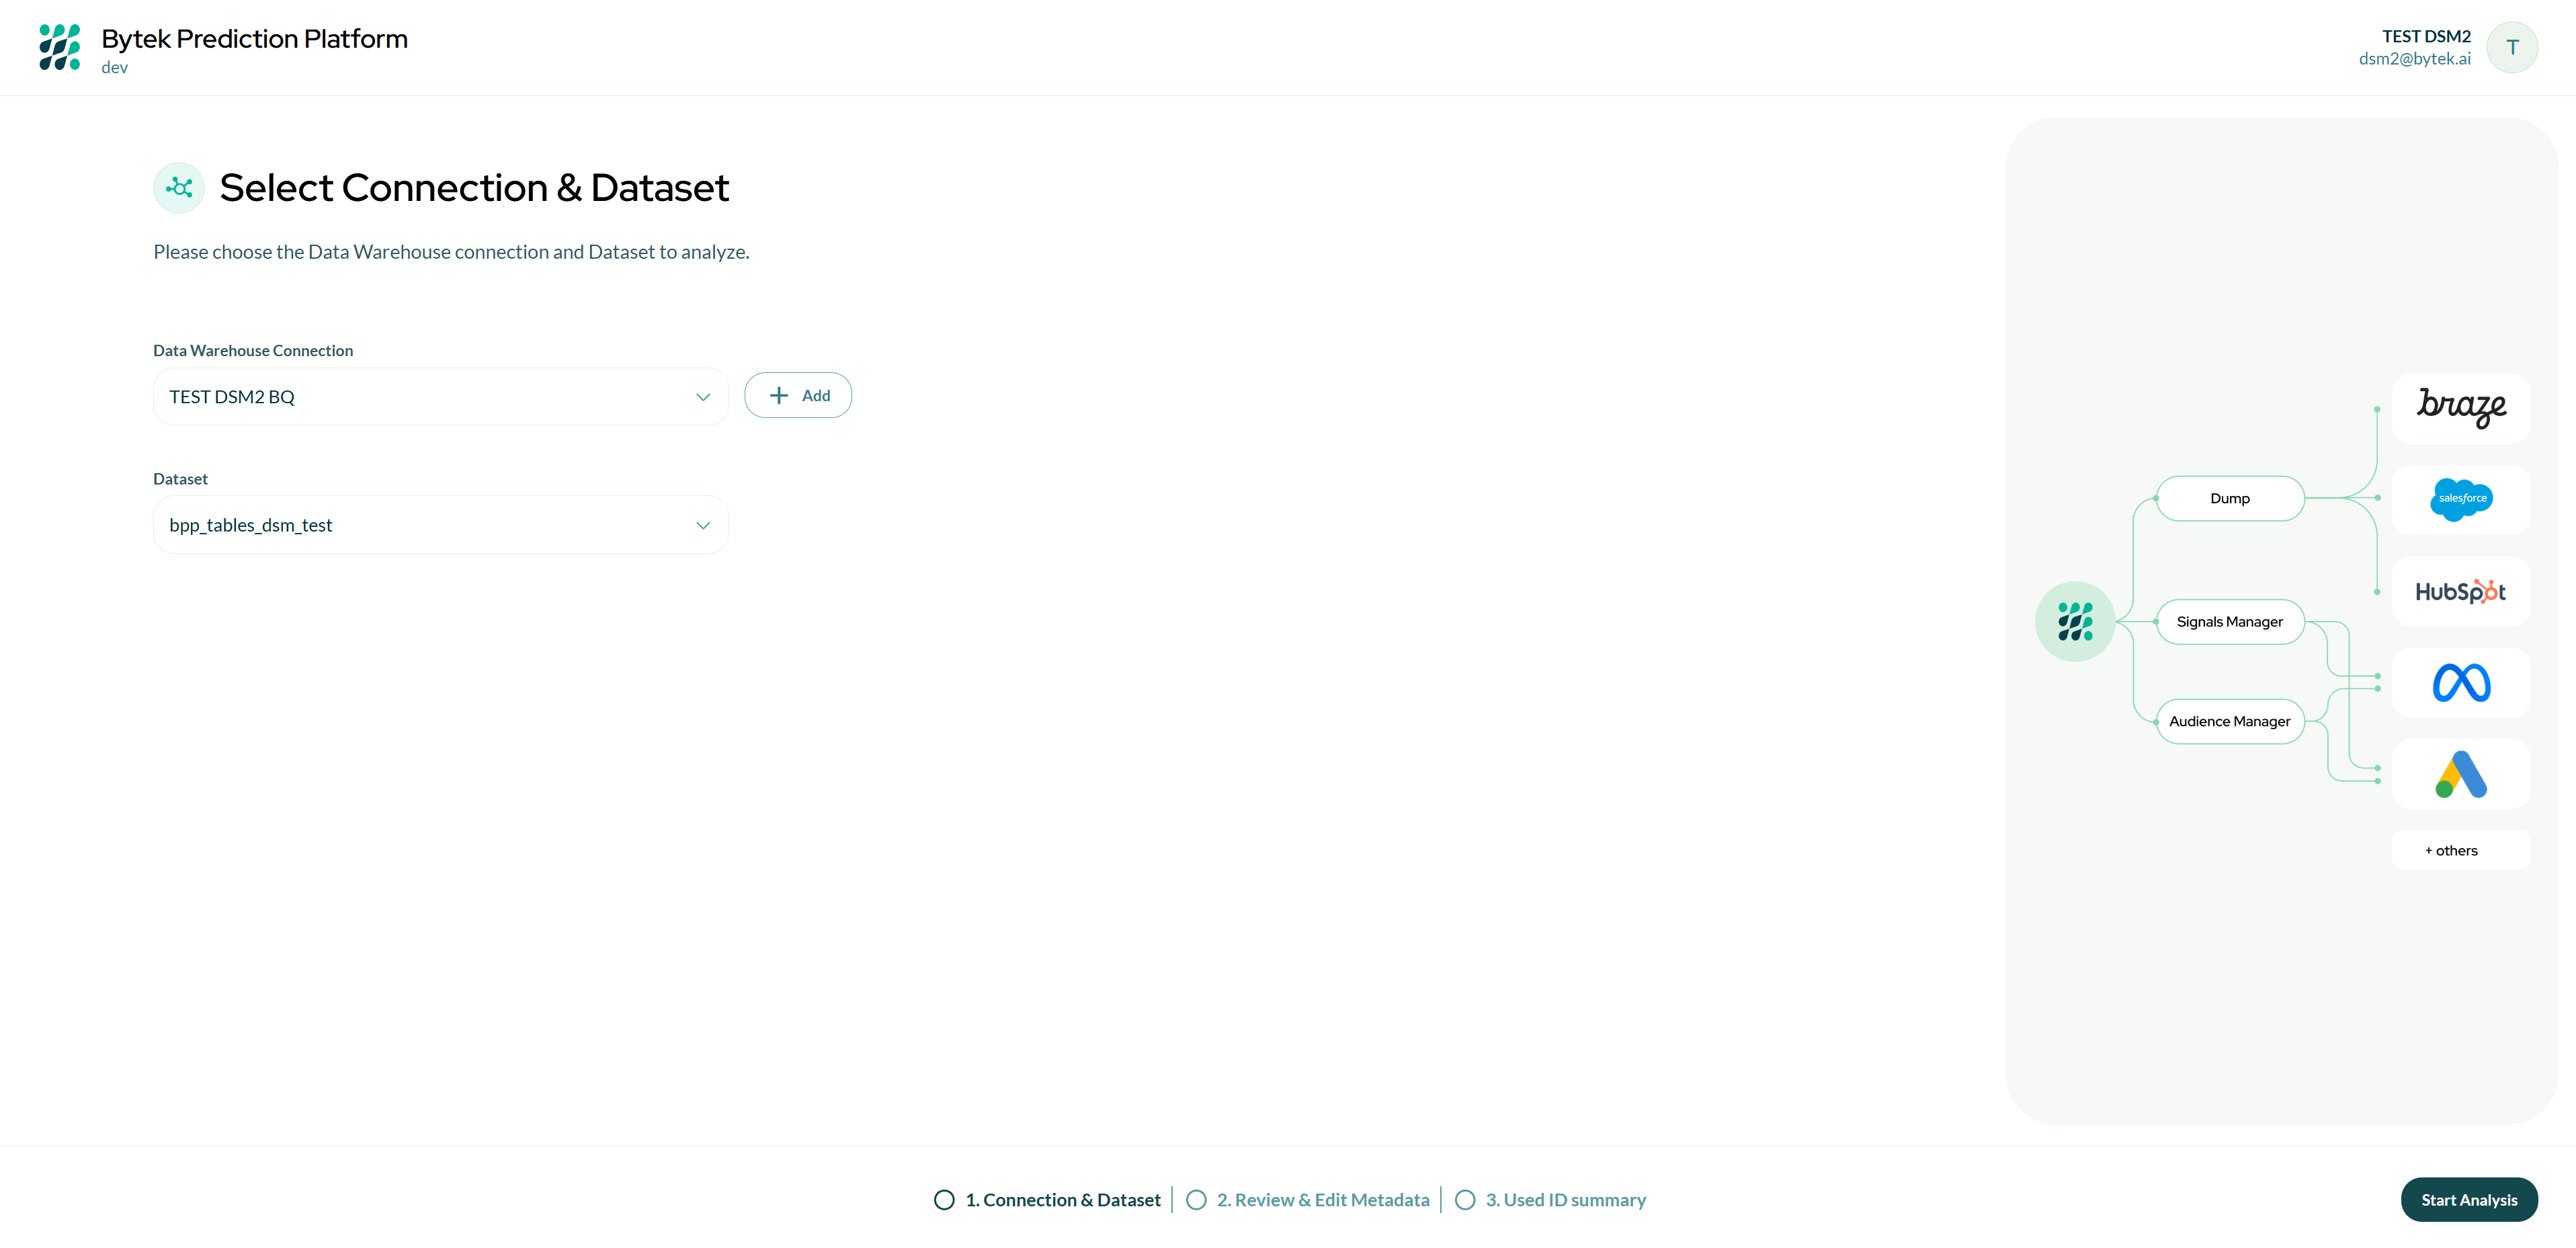
The first time you log in to the platform you will be automatically redirected to the DSM where you will be asked to:
- Choose a Connection to BigQuery (or create one if you don't already have it)
- Select the BigQuery dataset you want to connect to BPP.
- Click Connect to proceed.
The service account you will use must have all the required GCP Permissions.
Analysis
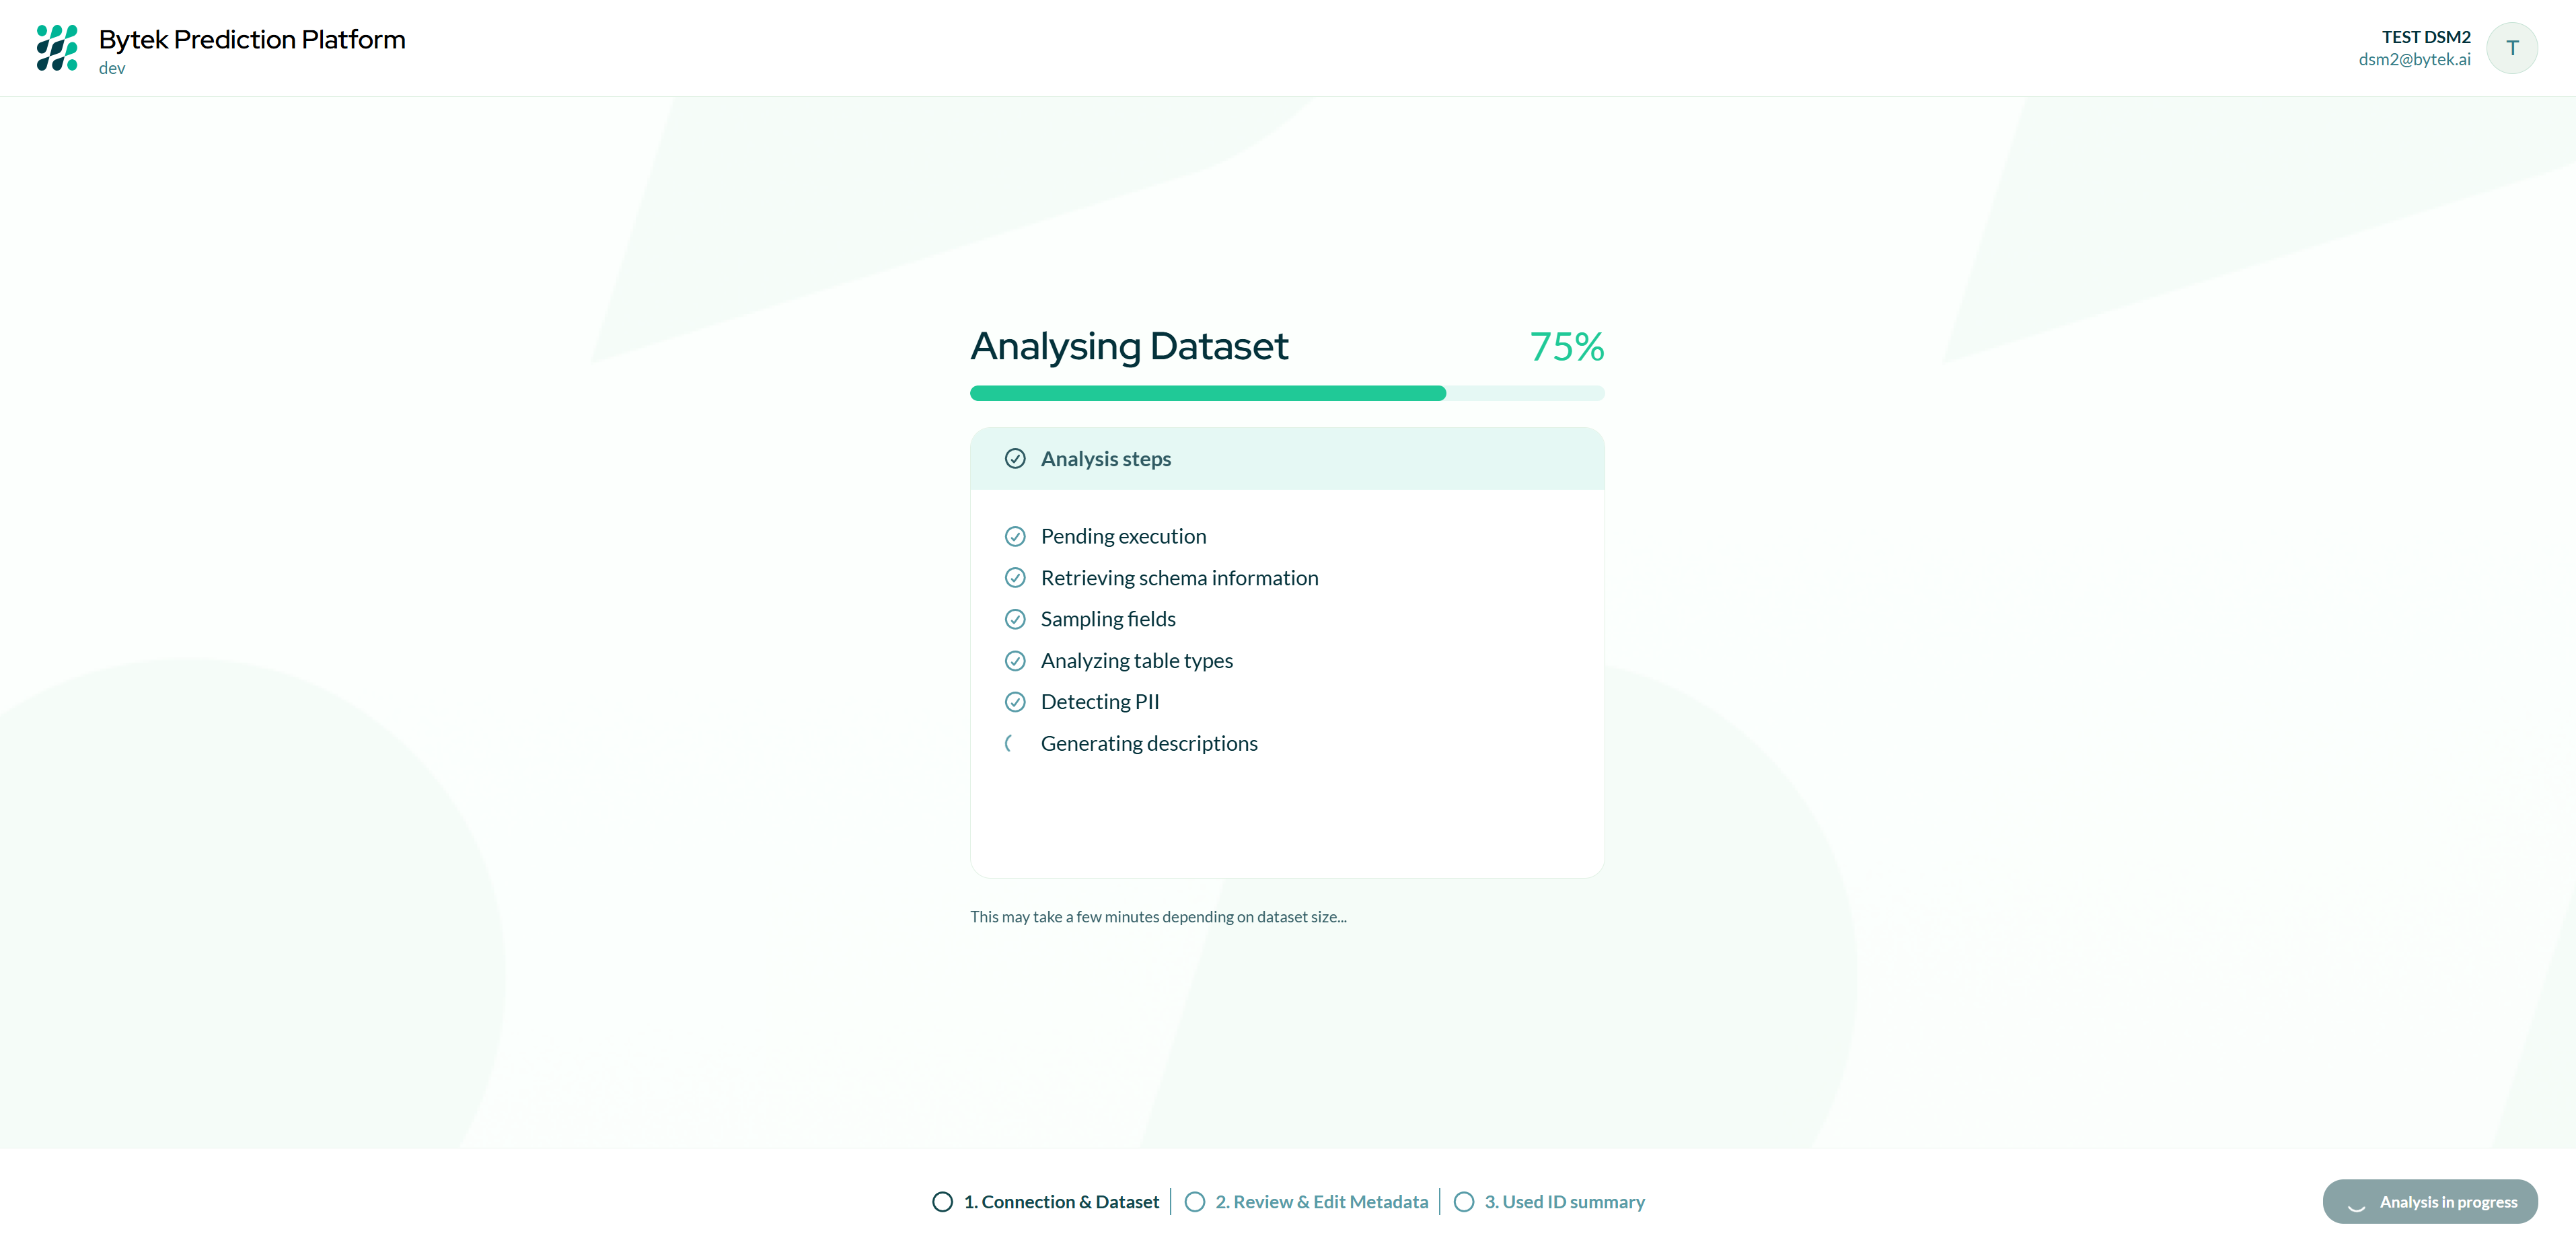
BPP scans your dataset, reads every table's schema, samples values, and drafts a complete configuration — classifications, identifiers, labels and descriptions. This is what the wizard opens on.
Analysis typically takes a few minutes depending on dataset size. The screen refreshes automatically when complete.
What the analysis proposes
For every table and field, the analysis proposes a starting configuration that you review in the next step:
- Table type — whether a table holds one row per person (user table) or one row per action, such as orders or page views (event table). This is read mainly from the table name, with the data as a fallback.
- User identifiers and their type — the columns that identify a person, such as emails, CRM codes, Salesforce ids or GA client ids. They are recognised from the shape of their values, not only from the column name.
- Shared identifier types across tables — two columns that contain the same values get the same identifier type, even when their names differ. For example, a GA4
user_idthat carries your CRM customer code is linked to the CRM table's customer code. - Unused tables — tables with nothing that identifies a person, such as a product catalogue or a lookup table, are proposed as unused.
- Descriptions — a short description for each field.
Your data and your BigQuery usage
- No data value is sent to the AI model that writes the field descriptions. It only receives table and column names, statistics (such as fill rate and number of distinct values) and the masked shape of the values. For example, an email address becomes
aaaa@aaaa.aa. - The analysis reads a sample of your tables (about 100,000 rows per table) in your BigQuery project. Every query is estimated before it runs and skipped above a fixed limit: at most 20 GiB per table for the field statistics, and at most 5 GiB for the comparison of identifiers across tables. Most datasets need far less.
The 5-step wizard
Each step is one decision, and each builds on the last: what your tables are, how people are recognised in them, what a merged person looks like, whether the event fields are labelled usefully, and finally a review before anything is written.
| Step | The decision |
|---|---|
| 1 — Classify Tables | Is this table about people, or about what they did? |
| 2 — User Identifiers | Which columns point at a person, and what kind of ID is each? |
| 3 — User Model | When sources disagree, which value wins? |
| 4 — Event Mapping | Do the event table's fields make sense to the people who use them? |
| 5 — Review & Activate | Is this right? |
Copilot has already drafted an answer to every one of them. You are curating, not building from scratch — and you can move back and forth with Back and the step rail before you activate.
While the first reconciliation runs
After Activate, the Onboarding Completed screen appears. When your workspace is ready, click Start using the platform: you do not have to wait for the first reconciliation to finish. Until it finishes, a banner at the top of every page says that your data is loading.
- You can already set up audiences, signals and AI models.
- Counts and previews are partial. Audience counts are marked Partial and grow as profiles are built.
- Exports wait. The Run button of audiences, signals and profile syncs is disabled until the first reconciliation finishes ("Available when the first reconciliation finishes"). Scheduled exports start after it.
The first reconciliation reads the last 7 days of events
To make the platform usable sooner, the first reconciliation does not read all your data:
| Table | What the first reconciliation reads |
|---|---|
| User tables (one row per user, e.g. a CRM) | All rows. |
| Event tables (partitioned by date, e.g. GA4 events, orders) | Only the last 7 days, plus the rows without a date. |
The rest of the event history is read by the next nightly update. Until then the banner says "Event history is still loading", and:
- Event history before the last 7 days is missing from the platform. Fields, filters and AI model features based on older events (for example, purchases in the last year) are incomplete.
- Some people are still split into several profiles. Two identifiers seen together only in older events (for example, a cookie and an email on a 3-month-old order) are linked by the nightly update. The profiles then merge and keep the oldest Bytek ID (see How profiles are kept stable).
- Counts grow after the nightly update, because the profiles that only appear in older events arrive with it.
The nightly update that loads the history takes longer and costs more than a normal update, because it reads every event table in full once. From then on, updates read only the new data.
Tips
- The wizard auto-saves — you can leave and return later without losing your place.
- Nothing is written to the platform until you click Activate on Step 5.
- You can start using the platform while the first reconciliation runs; exports wait until it finishes.
- Spend your time on Steps 2 and 3. After activation the schema is add-only — labels, descriptions, visibility and the user model stay editable, but identifier types and field structure do not.
- Start over (beside the page title) discards the datasource and the whole draft, and runs the analysis again from scratch. It cannot be undone.
- After onboarding, use the Datasource Manager page (Tables Configuration) to edit labels, descriptions and the user model without onboarding again.
- To add new BigQuery tables to the platform, use Add Tables.